
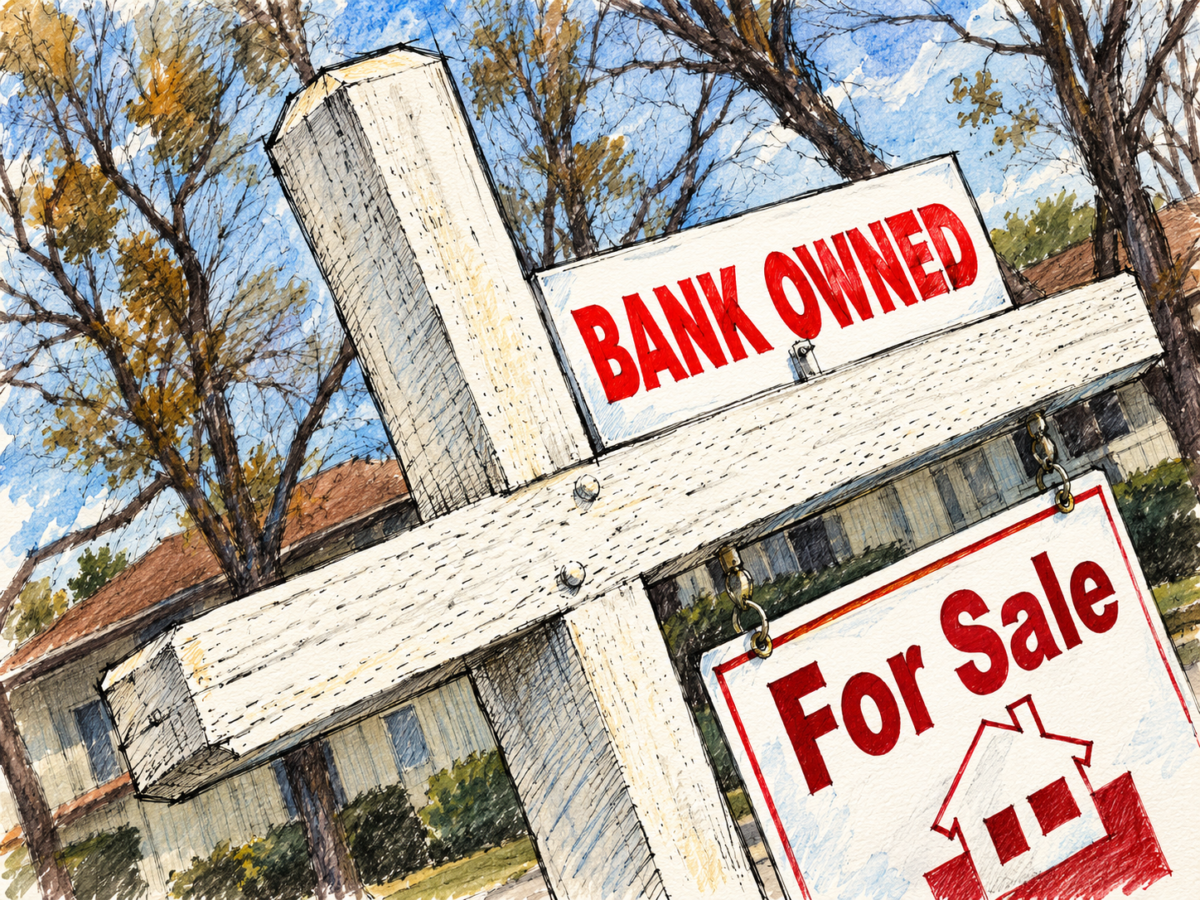
U.S. foreclosure activity continued to climb in August, with lenders repossessing 5,794 properties, a 42% increase from the same month last year, according to real estate data firm ATTOM.
The increase is significant, but the percentage alone gives an incomplete picture of the housing market.
Overall foreclosure activity remains substantially below pre-pandemic levels, and separate mortgage-performance data show that most American homeowners continue to make their payments.
ATTOM reported that 40,277 U.S. properties received some form of foreclosure filing in August, including default notices, scheduled auctions and completed bank repossessions. That was 13% higher than August 2025 and 1% above July. Foreclosure starts totaled 25,894, up 7% from a year earlier but down 3% from July.
Completed foreclosures, also known as real-estate-owned or REO properties, produced the much larger 42% annual increase cited in recent headlines. They were also up 22% from July.
But comparison with 2019 puts those numbers in perspective.
In August 2019, before the COVID-era foreclosure moratoriums and mortgage-relief programs disrupted normal foreclosure patterns, 53,007 U.S. properties received foreclosure filings. Lenders repossessed 11,493 properties that month. ATTOM data
That means August 2026 had roughly 24% fewer foreclosure filings and about 50% fewer completed foreclosures than August 2019, despite the sharp year-over-year increases now being reported.
And 2019 itself was hardly a foreclosure-crisis year. ATTOM recorded 493,066 properties with foreclosure filings for all of 2019, the lowest annual total since the company began tracking the data in 2005 and 83% below the 2010 peak. ATTOM year-end data
ATTOM CEO Rob Barber described the current trend as an increase in financial pressure for some homeowners while emphasizing that overall foreclosure volumes remain well below historical norms. ATTOM release
Mortgage stress is increasing in some segments
The broader data do show deterioration compared with last year.
The Mortgage Bankers Association reported that 4.37% of residential mortgages were delinquent at the end of the second quarter of 2026. That was slightly lower than the previous quarter but 0.44 percentage points higher than a year earlier.
Loans in the foreclosure process increased to 0.67% of outstanding mortgages, while the share of loans considered seriously delinquent also increased for a fourth consecutive quarter. Mortgage Bankers Association
The pressure has been particularly pronounced among FHA borrowers.
MBA reported an FHA delinquency rate of 11.79% during the second quarter, compared with 2.72% for conventional mortgages. FHA serious delinquencies were up more than two percentage points from a year earlier. Mortgage Bankers Association
That suggests the increase in distressed mortgages is not evenly distributed across homeowners.
At the same time, data from Intercontinental Exchange paints a considerably less alarming picture of overall mortgage performance.
ICE reported an August national mortgage delinquency rate of 3.53%, just 0.10 percentage points higher than a year earlier and 0.35 percentage points below August 2019. ICE said the delinquency rate remained below every pre-pandemic August in its historical data.
Seriously delinquent loans represented 1.04% of active mortgages, almost identical to the 1.03% average recorded during August from 2017 through 2019. ICE mortgage data
ICE also found that foreclosure sales were running at only 57% of their August 2019 pace.
The different surveys use different loan populations and methodologies, but both point to the same broader conclusion: homeowner distress has increased from unusually low recent levels without approaching the conditions associated with the housing crash of 2008.
Texas leads in completed foreclosures
Texas stands out more clearly.
Lenders repossessed 1,835 Texas properties during August, by far the largest number of any state. California ranked second with 589, followed by North Carolina with 356, Arizona with 296 and Alabama with 286. Foreclosure data
Three Texas metropolitan areas also led the nation in completed foreclosures:
Houston recorded 448, Dallas 402 and San Antonio 256. Phoenix followed with 186 and Baltimore with 167. Foreclosure data
San Antonio’s August total was double the 128 completed foreclosures reported in July. ATTOM July report
Those raw totals, however, should not be confused with foreclosure rates.
South Carolina had the country’s highest August foreclosure rate, with one filing for every 1,547 housing units. Nevada followed at one in 1,920, Florida at one in 2,397 and Texas at one in 2,445. August foreclosure rates
Texas also has a comparatively fast foreclosure process. ATTOM found that properties completing foreclosure in Texas during the first half of 2026 had spent an average of 155 days in the process, the shortest average of any state. ATTOM analysis
Texas law permits foreclosure through a contractual power of sale without requiring a full judicial foreclosure proceeding in many cases. State law generally requires a residential borrower in default to receive at least 20 days to cure before notice of sale, followed by at least 21 days’ notice of the foreclosure sale. Texas Property Code
That faster process is relevant when comparing completed foreclosure counts between Texas and states where cases can remain tied up in courts for considerably longer periods.
Homeowner equity remains a major difference from 2008
Another important distinction from the housing crash is homeowner equity.
ICE reported that mortgage holders collectively had a record $18 trillion in home equity during the second quarter of 2026. About 47.5 million mortgage holders had approximately $11.7 trillion in equity that could potentially be tapped, averaging roughly $212,000 per borrower. ICE Mortgage Monitor
There are signs of weakness beneath those national figures.
ICE estimated that approximately 813,000 borrowers were underwater on their mortgages, up 44% from a year earlier. Negative equity was concentrated among FHA and VA borrowers, people who bought homes between 2022 and 2025, and homeowners in Texas and Florida, where prices have weakened more noticeably from recent peaks. ICE Mortgage Monitor
That concentration helps explain why foreclosure activity can rise significantly in particular states and borrower categories without representing equivalent financial stress across the entire housing market.
Higher property insurance costs are adding another burden. ICE reported in September that average annual homeowners-insurance costs had risen 8.7% from a year earlier, although the pace of increase had begun to slow. ICE September Mortgage Monitor
MBA has also pointed to signs of labor-market weakness and rising delinquencies on student loans, credit cards and auto loans as potential contributors to household financial stress. Mortgage Bankers Association
Current high mortgage rates are another obstacle for the housing market, but their effect should be distinguished from foreclosure risk. Higher market rates make new purchases and refinancing more expensive, but they do not increase the principal-and-interest payment for homeowners who already hold fixed-rate mortgages.
Rising foreclosures, but not yet a foreclosure crisis
The direction of the foreclosure data is clear.
During the first six months of 2026, 227,548 U.S. properties received foreclosure filings, 21% more than during the same period last year. Completed foreclosures increased 33%. ATTOM mid-year report
Yet the first-half total was still about 23% below the 296,458 foreclosure filings recorded during the first six months of 2019. ATTOM 2019 mid-year report
The latest figures therefore show a housing market with growing pockets of financial distress, particularly among some FHA borrowers and in states including Texas and Florida.
They do not, at least so far, show a nationwide foreclosure wave resembling the aftermath of the 2008 housing collapse.
The 42% increase in lender repossessions is real. Just as important is the number behind that percentage: 5,794 completed foreclosures nationwide in August 2026, compared with 11,493 during the same month in 2019.
For now, the evidence points more toward a normalization of foreclosure activity from unusually suppressed levels, combined with identifiable stress among some borrowers and markets, than toward a broad breakdown of the American mortgage system.